How to cite this blog post:
Joukhadar, Z., Spreadborough, K. (2020, November, 16) Data Flow. Kristal Spreadborough’s Blog https://kristalspreadborough.github.io/blog/2020/11/16/data-flow
This is an overview of one way to structure a projects pipeline and data folders. My colleague Zaher Joukhadar at the Melbourne Data Analytics Platform (MDAP) introduced me to this structure and described the various aspects of it to me over a series of conversations. Over the last few months, I have watched Zaher implement this and similar pipelines and data folders in MDAP collaborations. But I could not find a resource which put this process in writing. And such a resource was exactly what I needed not being a computer science native myself! Thanks to Zaher’s generosity with his time and willingness to share his experience and knowledge, I have committed the process to writing in this blog post as a resource for myself and others who might be interested. Full credit goes to Zaher - check out his website and follow him on the socials!
Table of Contents
1 Pipeline
The pipeline outlines the flow of code and data.

1.1 Code
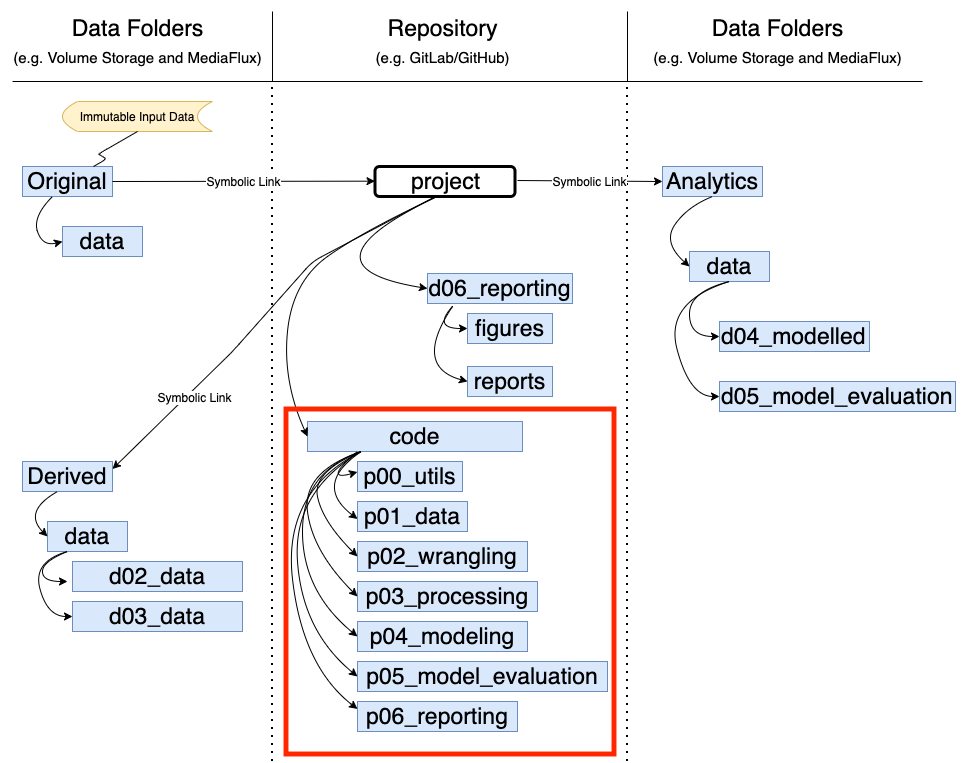
The code is contained within the module called ‘code’ (Note: this module can be called anything, ‘code’ is just for this example). The code is stored on the collaboration repository (repo).
‘code’ itself is a package. Each of the submodules are also packages. To get Python to treat each level module as a package, [include a init.py file within each submodule] (https://docs.python.org/3/tutorial/modules.html#packages). See below. Note: this will no longer be required if using Python 3.3 or later. However, having them won’t affect how the package runs so they may be useful to include incase the package is being run on earlier versions of Python.
All submodules containing code for the package start with the letter ‘p’. The numbers following indicate the order in which the packages should be run.

-
p00_utils: This module will be called by subsequent submodules. Use this module for performing and defining essential functions on which subsequent modules rely. For example, use this module to store scripts for converting Json to Csv, define file paths, define functions, merge data frames, and convert numbers to strings.
-
p01_data: This module will be used by subsequent submodules. Use this module to read and write data in and out. For example, use this module to read data in from MediaFlux (MediaFlux is a data storage solution that is used at the University of Melbourne, you may use something different such as your local computer, Dropbox, etc), get things from the data structures and export things to data structures, and functions for exporting data after wrangling, processing, modeling, evaluating, and reporting performed in subsequent modules.
-
p02_wrangling: This module will be used by the p03_processing submodule. Use this module for any task which harmonises and cleans the data, but doesn’t actually change the data. For example, use this module for any kind of conversion (drawing on scripts stored in p00_utils), cleaning, merging, excluding columns, and removing null values.
-
p03_processing: This module will be used by p04_modeling. Use this module for any task which actually changes the data. For example, use this module to convert ordinal values into numbers (e.g. reassigning male and female to 0 and 1), converting images to grey scale, and adding columns together.
-
p04_modeling: This submodule contains all the code to train the model(s). This module shouldn’t do any data manipulation, this should be taken care of by modules p03_processing and p02_wrangling. This module will produce the outcomes of the training models. These outputs can be saved as binary files so that you don’t need to train the model every time you want to evaluate it. Pickle is one way to do this https://docs.python.org/3/library/pickle.html.
-
p05_model_evaluation: This submodule contains all the code for checking if the models work as expected. It takes the trained models and applies it to a test set . It produces metrics which evaluate how good the model is after training. For example, accuracy, precision and recall confusion matrix.
Note: I tend not to produce models as part of my work, but rather focus on analyses and visualizations. For this reason, I tend to replace P04_modeling with p04_analysis and/or p04_visualizations. I tend not to use p05 at all.
- p06_reporting: Use this submodule for generating visualizations, figures, and other outputs for the end user. This module takes care of visualisations and collects evaluation results. For example, a pdf of figures with some explanatory text.
In addition to the code stored in these submodules, you may also want to have base and local yaml files. The local yaml file is stored only on your local machine and holds passwords, keys, tokens etc. It should not be pushed to the repo. The base yamal contains switches which allow particular scripts/submodules to be turned on and off, contains dependancies, etc. Adding these to the yaml rather than hard coding them makes updating easier.
You can also include a snakemake file which can be used for optimising performance in HPC environments: https://snakemake.readthedocs.io/en/stable/
1.2 Data Folders
All data folders start with ‘d’. The two numbers following indicate the submodule of the package to which the data folder corresponds. In this example, data folders are stored on Volume Storage and MediaFlux (these are specific storage solutions for University of Melbourne and you may have different storage solutions), and in the repository (repo).

In this example, data is written out after every submodule in the package ‘code’. This is not necessary, but it is a good way to be able to reverse engineer your steps if something goes wrong. It also means that you have the data ready to go if you want to pick up from a particular submodule of the package (e.g. you don’t have to the clean the data every time).
1.2.1 Volume Storage and Mediaflux
Original, derived, and analytics data folders are shown on either side of the repo. This is symbolic only, data are all stored in the same place (in this example, both Volume Storage - for working with the data - and MediaFlux - for backing up the data at every step). Never store this data on your repo. Not only are these files too large, but there could also be issues with Ethics (some data can’t be shared, but the code and outputs can). Also, there are better platforms for sharing data, such as FigShare.
-
Original data is as the title suggests - the original copy of the data. Consider it immutable - that is, never perform any actions on the original data. Always copy the Original data from the backup platform (e.g. MediaFlux) to the working platform (e.g. Volume Storage) and then manipulate this copied data.
-
Derived data contains two subfolders: d02_wrangled, and d03_processed. This contains the outputs from the corresponding submodules of the package: p02_wrangling and p03_processed. Write this out to Volume Storage for ease of access in the later steps of the package, and also back up to MediaFlux.
-
Analytics contains two subfolders: d04_modeled and d05_model_evaluation. This contains the outputs from the corresponding submodules of the package: d04_modeling and d05_processed. Write this out to Volume Storage for ease of access in the later steps of the package, and also back up to MediaFlux.
Note: As mentioned above, because I tend to work with analyses and visulisations, I use the Analytics folder to store these outputs.
1.2.2 Repository
The data folder d06_reporting on the repo contains the outputs of the p06_reporting submodule described above. It is hosted on the repo since these files are not very large. Hosting on the repo also makes these outputs easily sharable with the end users since they can be accessed by a link and downloaded. In this example, there are two subfolders, but you can use whatever subfolders suit your workflow:
- Figures: this folder contains visualizations.
- Reports: this folder contains information on module accuracy, and documents with visualisations and explanatory texts.
Note: you may prefer to keep d06_reporting in volume storage and MediaFlux - it doesn’t matter too much.
2 Data
This section is concerned with the original data:

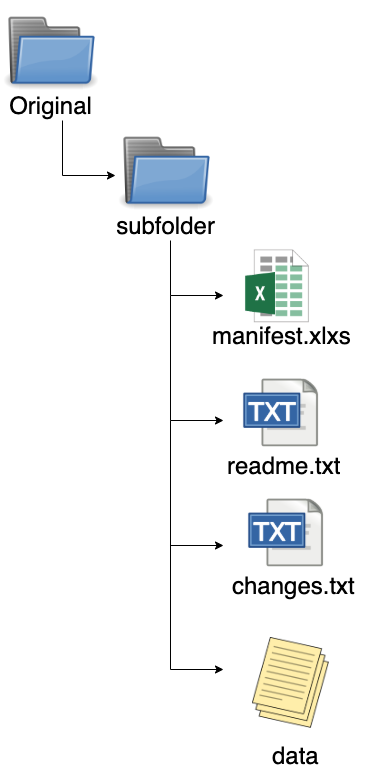
This is just one way to structure your original data, you can adapt as you need. How you group and order your folders and subfolders will depend on the nature of your data and the intended analysis. In this example, original data is grouped by type: Twitter and Hansard. In addition to the actual data, the following files can also be contained with in the folder structure:

- manifest.xlxs: a spread sheet containing:
| filename | timestamp | description | file type |
|---|---|---|---|
| Name of the file or folder. Should include path to file or folder. | Time or date stamp for file or n/a if not needed | A short description of the file | The type of file (either a description or the actual MIME type) |
- readme.txt: a text file that contains additional information and context that is not covered in the manifest.
- changes.txt: a text file that contains information about the history of the dataset or changes since initial publication/analysis.
- data: the actual data.
Note: think about these files containing metadata about the data. The metadata should be enough for someone else to be able to understand and reproduce the data.